Thursday, November 8, 2012

Australia’s Unemployment Rate steady at 5.4%

Today the ABS released its monthly Labour Force figures.

The headline figures were for the seasonally adjusted unemployment rate to remain steady at 5.4%, and the trend rate to rise from 5.3% to 5.4%

If we want to break it down to a few more decimal places (in which doing so also reduces the confidence with which the ABS is sure they’re accurate – but what the hell), then the seasonally adjusted rate fell from 5.4377156% to 5.3645712% or a fall of 0.07314 percentage points. So it was very close to being a fall to 5.3% and it is why the ABS actually says the rate fell by 0.1 percentage point even though there was no change in the actual rate when rounded to 1 decimal point.

OK let’s look at the graphs:

image

Pretty flat with a slight uptick. Looking closer over the past 12 months we see this more clearly:

image

The main reason unemployment fell (or remained steady) was because employment actually grew by 10,700 jobs (around 0.1%) and participation fell by about the same.

As you can see the past 2 years has been very patchy compeered to the good growth in later 2009 and 2010 as we came out of the GFC:

image

While growth in employment numbers is good, number of hours worked fell, which is not good:

image

If we look at this in trend terms you can see that as with total employment numbers, the past 2 years has been weak compared to 2009-2010 – let alone that nice pre-GFC period of 2006-mid 2008.

image

But the picture isn’t as bad as it looked to be a couple months ago. The below chart shows the changes in trend hours worked over the past 3 months. Back in August things looked to be going downwards, and this month now shows even better growth (or less decline to be exact) last month than was believed to have occurred last month.

image

But it all points to less hours being worked per person than we worked during the GFC. In fact it’s currently at record lows (though that is because there is more part-time work than there ever was in previously worse recessions such as in the 1990 and 1982 etc)

image

In some good news, full-time employment did increase this month – though it’s still weak

image

This increase in work led to a decrease the unemployment rate for those looking for full-time work

image

Once again the growth in employment is coming from women, not from men:

image

Now to my always favourite metric of the employment to population ratio we see a decline of 0.1 in trend terms and a steadiness at 61.7% in seasonally adjusted terms.

image

Which when compared to other recessions, shows the impact of our changing demographics and ageing population. Despite Australia not suffering from a recession at all, let alone one as severe as the 1981-82 recession, the impact on the labour force is now almost the same.

image

I seriously doubt we’ll ever return to the pre-GFC highs. We have lost too many older workers who are not being replaced”

image

Now onto the states, and we asks ourselves where would we like to not be living right now:

image

Yep, Queensland was the only state to have a decline in employment in seasonally adjusted terms. Well done Campbell Newman a real bang up job you’re doing there.

But maybe October was a glitch. Let’;s look at the past 12 months:

image

Queensland: The new Rust Belt State

How does this all play out in unemployment rate terms?

image

Not pretty. But such are the “benefits” of austerity.

***

On Twitter a few people asked me what is QLD’s unemployment rate compared to the rest of Australia – ie not including QLD.

A look at the unemployment rate shows that QLD has increased to the point where only Tasmania is above it. WA is down at 4.6%, NSW is on 5.2% (ie below the national average) and Victoria in on 5.4 (right on the average) and SA is on 5.6% (just above the national average).

image

To look at the rest of Australia I excluded the ACT and NT because the ABS doesn’t give their unemployment rate out in seasonally adjusted terms – only in Trend. Given their small populations I doubt it would change much anyway, and given the ACT’s unemployment trend rate is 4.1% and the NT’s is 4.5% it would actually make thing look worse for Queensland than they do.

image

Without Queensland the unemployment rate would be 5.24%. Back in Jun the Rest of Oz rate was 5.21% and QLD was 5.32%. Since then the Rest of Aus rate has increased by .03 percentage points, whereas QLD’s has increased 0.84 percentage points.

Or as Possum would say, “They’ve been Newmanned”.

Wednesday, November 7, 2012

2012 US Election: Obama and maths win

Today in a resounding win for maths, Barack Obama beat Mitt Romney.

Before we get to the politics, the win was a win for the pollsters, and for those who created models based on their aggregated data. The big winner has been The NY Times’ Nate Silver, but in reality pretty much all forecasters were predicting and Obama win.

For example on the Huffington Post here was the predicted map:

Prediction

Of the 4 “tossup states”, Obama was ahead in Colorado and Virginia; Romney was ahead in North Carolina. Florida was split 48%-48% And here’s how it ended up:

2012 Result

Obama won Colorado and Virginia as expected and Mitt won North Carolina as expected. And in the end Obama won Florida just to get the cherry on top.

All Obama lost from 2008 was Indiana and North Carolina which voted Republican even when Clinton was running in 1992 and 1996, let alone when George W won in 2000 and 2004. So it wasn’t a case of Romney making inroads, but more just getting back what the GOP used to take for granted.

With still around 25% of California’s vote to count, Obama leads by over 2 million votes. He has 50.1% of the vote, and because he’s winning California by around 57% he’ll likely end up with around 50.2%ish to Romney’s 48.3%ish.

The final Real Clear Politics average of the polls had Obama up 48.8% to 48.1%, Nate Silver had Obama projected to win 50.8% of the vote to Mitt’s 48.3%. So RCP under-estimated Obama’s share, and Silver slightly over-estimated it. Mind you Silver’s projection was for Obama to only win 313 electoral college votes, so he wasn’t exactly over-egging Obama’s chances.

It was a big loss for right wing pundits who were right till the very end (even past the end in Karl Rove’s case) suggesting the vibe and feel on the ground was at great variance to what the polls were suggesting. The Wall Street Journal’s Peggy Noonan was a classic example. Yesterday she wrote:

Everyone’s guessing. I spent Sunday morning in Washington with journalists and political hands, one of whom said she feels it’s Obama, the rest of whom said they don’t know. I think it’s Romney. I think he’s stealing in “like a thief with good tools,” in Walker Percy’s old words. While everyone is looking at the polls and the storm, Romney’s slipping into the presidency. He’s quietly rising, and he’s been rising for a while.

Now I don’t mind someone sticking her neck out and making a prediction, but a bit of substantial evidence wouldn’t go astray (especially when the Mitt’s rising” bit went against what the polls were showing). Instead Noonan served up this:

Who knows what to make of the weighting of the polls and the assumptions as to who will vote? Who knows the depth and breadth of each party’s turnout efforts? Among the wisest words spoken this cycle were by John Dickerson of CBS News and Slate, who said, in a conversation the night before the last presidential debate, that he thought maybe the American people were quietly cooking something up, something we don’t know about.

I think they are and I think it’s this: a Romney win.Twitpic - Share photos and videos on Twitter
Let this be a good example of to stop listening to people who say the polls are wrong because people running the polls obviously can’t be bothered trying to do their job right. The right wing seemed to live under the assumption that the polls were all purposefully being stupid – as though these companies wanted to be wrong.

When the supporters of a political party start telling you all the polls are wrong and that the vibe is with their side, know that they are picking up straws and clutching them like mad.

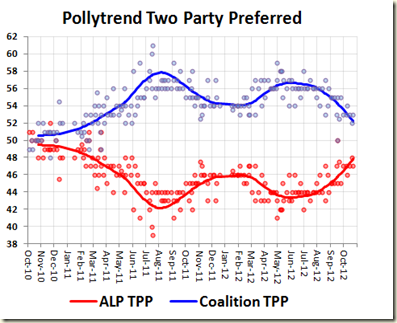
Yes a poll can be “wrong” but when you start collating lots of them, for them to be wrong you need to start assuming a lot of things don’t gel with reality. It’s why in Australia you don’t need to worry about individual poll movement – but instead be smart and look at Possum’s Pollytrend.

You can talk all you like about “the vibe” and how great the feel is out there “on the ground”. But if, come a day before the next election, the ALP is still running at 48% on the pollytrend, they won’t win.

Let the trend be your friend (and also let it make you look like you know what you’re talking about).

In the USA, a couple electoral maps (via the NY Times)  show the problem for the GOP in winning the Presidency.

First the vote by county (red is Republican)

2012 County vote

As you can see – lots of land mass is red. It looks like  America should be Republican

But now look at the margins of victory per county:

2012 Margin

Where Obama won big was in the big cities; where Mitt won big was in places that didn’t matter because they were never in play – such as Utah.

In Colorado for example Obama won big in and around Denver and Boulder. In Florida he won the Miami-Dade Country with 62% of the vote – that county had around 829,000 voters, next door in Broward County he won with 67%. It has around 719,000 voters. Together those 2 counties account for nearly 20% of the entire state’s vote.

In Ohio it’s the same story:
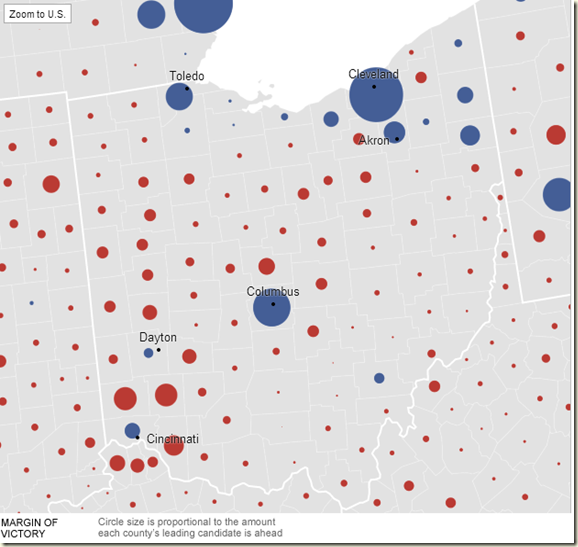
Ohio

Obama won big in Cleveland, Columbus and Toledo. Romney won in Cincinnati but not by enough to make up for those losses – and that county in Cincinnati that he won (Clermont County) had only 94,000 voters. In the Cleveland county that Obama won big (Cuyahoga County) there are 610,000 voters, and Obama won with 69% of the vote (or by 236,000 votes). 

It’s also worth noting that even if Mitt won both Ohio and Florida, he still would’ve lost the election. When you’re in that kind of a scenario, you can’t say the election was close.

To change this map, the GOP has to come up with someone who can win in the cities – which means maybe not running a campaign that (to paraphrase Obama in 2008) is concerned about scared people who cling to their guns and religion.

The worry for those who would like to see a sensible Republican Party is that the Tea Party movement is not real big on logic. I can see them blaming this result on the fact that Mitt was too moderate (as was John McCain in 2008 in their view), and that Chris Christie betrayed them by embracing Obama after the Hurricane, and that they really needed someone like Rick Santorum or Paul Ryan.

Now that might get them a big result in Kentucky, but sure as heck won’t win them back Pennsylvania or Ohio.

One small hope for sanity is that the Tea Party got pretty well slapped this time round. Todd Akin – he of the “legitimate rape comment” – lost his Senate race in Missouri gaining only 40% of the vote. This was a state that Romney won with 54%.

Similarly Richard Mourdock – he of the pregnancy from rape is “something God intended to happen” comment – lost his Senate race in Indiana with only 44.4% of the vote. Again this is a state Romney won with 54.3%.

Similarly the candidate for head nutter of the Congress, Michel Bachmann, won her seat with only 50.6% of the vote. Her district has actually been rezoned since the last election and was supposed to be more Republican. This was a woman who actually tried to run for President with Tea Party support, and she only sneaked in.

Unfortunately there will be those in the Republican Party who instead of facing reality will follow Donald Trump’s lead:

The Donald

Including this woman (via @greenat16)

Just a few things wrong

***

Four years ago Obama’s victory speech was damn impressive. It drew heavily on Martin Luther King Jr.

Tonight’s speech was in some ways more impressive. It seemed more his own. One less concerned with remarking on the history of the moment but rather looking ahead – in fact looking “forward” (who knew “moving forward” could be a winning slogan!).

The best part of the speech invoked the usual American exceptionalism that is in all such speeches but nicely – and touchingly – brought it together with his policy for health care:

I am hopeful tonight because I've seen the spirit at work in America. I've seen it in the family business whose owners would rather cut their own pay than lay off their neighbors, and in the workers who would rather cut back their hours than see a friend lose a job.

I've seen it in the soldiers who reenlist after losing a limb and in those SEALs who charged up the stairs into darkness and danger because they knew there was a buddy behind them watching their back.

I've seen it on the shores of New Jersey and New York, where leaders from every party and level of government have swept aside their differences to help a community rebuild from the wreckage of a terrible storm.

And I saw just the other day, in Mentor, Ohio, where a father told the story of his 8-year-old daughter, whose long battle with leukemia nearly cost their family everything had it not been for health care reform passing just a few months before the insurance company was about to stop paying for her care.

I had an opportunity to not just talk to the father, but meet this incredible daughter of his. And when he spoke to the crowd listening to that father's story, every parent in that room had tears in their eyes, because we knew that little girl could be our own.

And I know that every American wants her future to be just as bright. That's who we are. That's the country I'm so proud to lead as your president.

And with that, here we go – four more years:

Tuesday, November 6, 2012

The Reserve Banks keeps the cash rate at 3.25%

Today’s announcement by the RBA to keep the cash rate unchanged was a bit of a shock for most predictors. Certainly the foreign exchange market didn’t see it coming, with the dollar jumping around 0.60 cents against the US dollar within minutes of the announcement being made:

AUDUSD Chart (Australian Dollar - US Dollar Forex Chart)

Of course just because economists get a prediction wrong doesn’t mean it should be that much of a shock. But it certainly suggests a more bullish outlook from the RBA than was expected.

Of course rates are still waaaay down low:

image

The cash rate remains over 2 percentage points below the 20 year average, and 1.38 percentage points below the 5 year average which now covers pretty much all of the Rudd/Gillard Government.

But to discover why the RBA made no change let’s have a look at the difference between the Governor’s statements from today and last month – and I’ll highlight the differences

First Global conditions:

November:
Global growth is forecast to be a little below average for a time. Risks to the outlook are still seen to be on the downside, largely as a result of the situation in Europe, where economic activity is still contracting. Risks elsewhere seem more balanced. The United States is recording moderate growth, while recent data from China suggest growth there has stabilised. Around Asia generally, growth has been dampened by the more moderate Chinese expansion and the weakness in Europe.

October:
The outlook for growth in the world economy has softened over recent months, with estimates for global GDP being edged down, and risks to the outlook still seen to be on the downside. Economic activity in Europe is contracting, while growth in the United States remains modest. Growth in China has also slowed, and uncertainty about near-term prospects is greater than it was some months ago. Around Asia generally, growth is being dampened by the more moderate Chinese expansion and the weakness in Europe.

The only real difference is the suggestion that US growth has gone from “modest” to “moderate” and China’s growth has moved from “slowed” to “stabilised”

Since October, the USA 3rd quarter GDP figure have come out showing a 2% growth in the past 12 months:

image

Which I guess is “moderate’

And China’s GDP growth came in at 7.4% for the same quarter, and does shows sings of “stabilizing”:

image

Now to commodity prices:

November:
Key commodity prices for Australia remain significantly lower than earlier in the year, though trends have been more mixed over the past couple of months, with some prices recovering some ground while others declined further. The terms of trade have declined by about 13 per cent since the peak last year, but are likely to remain historically high.

October:
Key commodity prices for Australia remain significantly lower than earlier in the year, even though some have regained some ground in recent weeks. The terms of trade have declined by over 10 per cent since the peak last year and will probably decline further, though they are likely to remain historically high.

Here the news is all bad. In October prices seemed to have regained some ground, today however the RBA was saying the “mixed”. In October the terms of trade had declined by “over 10 per cent”, now a more specific figure is cited – that of “13 per cent”.  But iron ore prices have increased since October. They’re now around $120 – up from around $100 in September.

Financial markets? Nothing at all has changed:

November:
Financial markets have responded positively over the past few months to signs of progress in addressing Europe's financial problems, but expectations for further progress remain high. Long-term interest rates faced by highly rated sovereigns, including Australia, remain at exceptionally low levels. Capital markets remain open to corporations and well-rated banks, and Australian banks have had no difficulty accessing funding, including on an unsecured basis. Borrowing conditions for large corporations are similarly attractive. Share markets have generally risen over recent months.

October:
Financial markets have responded positively over the past few months to signs of progress in addressing Europe's financial problems, but expectations for further progress remain high. Low appetite for risk has seen long-term interest rates faced by highly rated sovereigns, including Australia, remain at exceptionally low levels. Nonetheless, capital markets remain open to corporations and well-rated banks, and Australian banks have had no difficulty accessing funding, including on an unsecured basis. Share markets have generally risen over recent months.

Note as well that “Capital markets remain open to corporations and well-rated banks, and Australian banks have had no difficulty accessing funding, including on an unsecured basis.” (Just in case there are still a few people around trying to sell you the whole “the Govt’s debt is crowding out investors” theory.)

Now to domestic conditions.

Once again there has been next to no change in the labour market or in general growth since October. The RBA changed around the paragraphs a bit, but the wordage is the same:

November:
In Australia, most indicators available for this meeting suggest that growth has been running close to trend over the past year, led by very large increases in capital spending in the resources sector. Looking ahead, the peak in resource investment is likely to occur next year, at a lower level than expected six months ago. As this peak approaches, the Board will be monitoring the strength of other components of demand.

Some of the consumption strength in the first half of 2012 was temporary, but there have been some signs of ongoing growth, though a return to very strong growth in consumption is unlikely. While investment in dwellings has been subdued for some time, over recent months there have been some indications of a prospective improvement. Non-residential building investment has remained weak. Public spending is forecast to be subdued.

October:
In Australia, most indicators available for this meeting suggest that growth has been running close to trend, led by very large increases in capital spending in the resources sector. Consumption growth was quite firm in the first half of 2012, though some of that strength was temporary. Investment in dwellings has remained subdued, though there have been some tentative signs of improvement, while non-residential building investment has also remained weak. Looking ahead, the peak in resource investment is likely to occur next year, and may be at a lower level than earlier expected. As this peak approaches it will be important that the forecast strengthening in some other components of demand starts to occur.

Now we get to the big difference – inflation.

November:
Recent outcomes on inflation were slightly higher than expected
, though they still show inflation consistent with the medium-term target, with underlying measures around 2½ per cent over the year to September, and headline CPI inflation a little lower than that. The introduction of the carbon price affected consumer prices in the September quarter, and there could be some further small effects over the next couple of quarters. With the labour market having generally softened somewhat in recent months, and unemployment edging higher, conditions should work to contain pressure on labour costs in sectors other than those directly affected by the current strength in resources. This and some continuing improvement in productivity performance will be needed to keep inflation low, since the effects on prices of the earlier exchange rate appreciation are now waning. The Bank's assessment remains that inflation will be consistent with the target over the next one to two years.

October:
Labour market data have shown moderate employment growth and the rate of unemployment has thus far remained low. The Bank's assessment, though, is that the labour market has generally softened somewhat in recent months.

Inflation has been low, with underlying measures near 2 per cent over the year to June, and headline CPI inflation lower than that. The introduction of the carbon price is affecting consumer prices in the current quarter, and this will continue over the next couple of quarters. Moderate labour market conditions should work to contain pressure on labour costs in sectors other than those directly affected by the current strength in resources. This and some continuing improvement in productivity performance will be needed to keep inflation low as the effects of the earlier exchange rate appreciation wane. The Bank's assessment remains, at this point, that inflation will be consistent with the target over the next one to two years.

In October the underlying measures were “near 2 per cent”; in November it was “around 2 1/2 per cent”. That difference was the key reason why the RBA held off dropping rates- they don’t want to be seen dropping rates while inflation possibly might be increasing unless the other signs in the economy (both here and abroad) are all negative. .

It agrees with what I suggested when the last CPI numbers came out, where I wrote:

The only aspect I think that might get the RBA to pause and not cut rates on Cup Day is that given the past 6 months has seen a combined 1.5% increase in the weighted median and a 1.3% rise in the trimmed mean the RBA might think that annualizes out to around the 3.0% – ie a the top on the band and thus decide it is best to wait and see what the December quarter holds before cutting the rates.

Not that this makes me a genius – I still predicted a cut in rates!

Now on to the conclusion, and a look at where the RBA sees monetary policy at the moment:

November:
Over the past year, monetary policy has become more accommodative. Interest rates for borrowers have declined to be clearly below their medium-term averages and savers are facing increased incentives to look for assets with higher returns. While the impact of these changes takes some time to work through the economy, there are signs of easier conditions starting to have some of the expected effects. Business demand for external funding has increased this year, the housing market has strengthened and share prices have risen in line with markets overseas. The exchange rate, though, remains higher than might have been expected, given the observed decline in export prices and the weaker global outlook.

October:

Interest rates for borrowers have for some months been a little below their medium-term averages. There are tentative signs of this starting to have some of the expected effects, though the impact of monetary policy changes takes some time to work through the economy. However, credit growth has softened of late and the exchange rate has remained higher than might have been expected, given the observed decline in export prices and the weaker global outlook.

They have changed from thinking rates are “a little below” to “clearly below” medium-term averages. With regards to home loans they are right, but with respect to small businesses, the rates remain slightly above average:

image

On this point it is worth noting that the spread of the cash rate to the small business overdraft rate actually increased in the past month:

image

It also mentioned housing prices which brings us to the House Price Index data released today by the ABS, that showed a 0.3% annual growth across the capital cities.

image

So not exactly a housing price boom, but I guess it has “strengthened” (given anything positive is stronger than negative).

Now to the end:

November:
Further effects of actions already taken to ease monetary policy can be expected over time. The Board will continue to monitor those effects, together with information about the various other factors affecting the outlook for growth and inflation. At today's meeting, with prices data slightly higher than expected and recent information on the world economy slightly more positive, the Board judged that the stance of monetary policy was appropriate for the time being.

October:
At today's meeting, the Board judged that, on the back of international developments, the growth outlook for next year looked a little weaker, while inflation was expected to be consistent with the target. The Board therefore decided that it was appropriate for the stance of monetary policy to be a little more accommodative.

The big differences – the higher than expected inflation data and the “slightly more positive” world economy (seriously, they must have been turning up the rose coloured glasses to “blinding” to think the world economy is more positive on the basis of China and the USA GDP growth.

And there the cash rate rests. Until December – at which point the market still expects there is a slightly better than even chance the RBA will drop rates to 3%.

Thursday, November 1, 2012

On the QT: Combet has them at the jump

OK, Question Time today, as ever was pretty dull, but yesterday and today Combet has been having a bit of fun with Tony Abbott’s predictions about the impact of the carbon price. Today Combet rather tortiously made mention of predictions made about the impact on sporting event to get onto talk of the Spring racing carnival, wherein he ran his eye over the Liberal Party form guide  (the good stuff starts at the 2:04 min mark)

Now here’s the best things about it :

Turnbull

Turnbull knows how to laugh at himself (and perhaps also at the current Liberal Party Leadership) – and even Kevin Andrews begrudgingly cracks a smile.

Scott Morrison is less impressed, but still chuffed that he’s getting a mention:

Morrison

But Julie Bishop? We are not amused:

Bishop

Export Prices go down the slippery dip

The ABS today released the quarterly International Trade Price Indexes, and if you were hoping for signs that the boom in mining prices was still going, I suggest you avert your eyes:

image

In the past quarter there was a drop of 6.4% for a 13.4% drop over the past 12 months:

image

image

Let’s get specific; how about coal?

image

Ugly.

And all metal ores and minerals together?

image

When it comes to thinking about managing the budget ask yourself which do you think would be trickier.

This:

image

or this:

image

or in terms of changes from the previous year, 1996-2012  it looks like this:

image

If predictability is your go, you best not want to take over the Treasury in around December 2007, because things started going a bit upsie downsie.

Drum Piece on Surplus and Credit Ratings Agencies

My Drum piece this week has a look at the idiocy of chasing a good credit rating, even if it puts your economic growth at risk. We’re seeing Queensland right in the midst of such a play at the moment, when given the low bond yields (record lows) worrying about what a credit rating agency thinks at the moment is pretty low on the list of things governments should worry about.

image

That S&P is putting WA on a negative watch says all you need to know about their worth. To recap – here was the employment growth in WA over the past 12 months:

image

I also had a look at UK growth versus Australia’s growth this century, to show just how horrific things are over there – and why going for austerity might not be the most wise policy of David Campbell right now:

image

Here’s also a look at Australia versus European Union’s GDP growth:

image

And the USA:

image

Or to give it real context, let’s look at growth since the start of the GFC:

image

(The reason Australia's graph is shortest is because we entered the GFC later than both USA and UK).

Also interesting is that since reaching the bottom of the GFC, Australia and USA recovered at about the same pace – but the USA has been recently falling behind.

The UK on the other hand was only able to keep pace with the recovery for about a year and then flattened out. The UK has only grown 3.4% in the whole 13 quarters – over 4 years) since it began “recovering” from the GFC. To give that context, in the 4 quarters from June 2011 to July 2012 Australia grew by 3.7%

image