Wednesday, February 6, 2013

Drum Post– Life (and policy) is complicated

My Drum post today looked briefly at the two speeches given last week by Julia Gillard and Tony Abbott. I have a bit of a slap at Abbott for essentially keeping to the line he has been keeping to for 2 years that life will be great and wonderful under a Liberal Government because in 2004 the budget was in surplus.

Also removing the carbon price will make the world a joyous place with tangerine trees and marmalade skies and other wonders to behold.

I have no problems with the Liberal Party slapping the PM and Swan about the head for having said squillions of times that they would deliver a surplus. The ALP shouldn’t have ever been playing the surplus is great game. They should have changed that story 4 years ago. They had the perfect opportunity but they didn’t due I think to massive insecurity on the part of Rudd and Swan and as a result they’ve kept to that mantra ever since. Stupid oh so stupid.

But if we’re going to talk about surplus and deficit, please let us talk in a language that makes sense. The Liberal Party is talking about how much more taxation is being raised now than in 2007. Well duh. The economy has grown since then, inflation has occurred sine then. Of course more taxation is collected now than then.

Since 1970-71 the only time taxation revenue has declined was in 1991-92 – ie when the recession hit, and 2008-09 and 2009-10 – ie during the GFC.

image

So this government for the first time had to deal with 2 successive years where gross revenue declined.

If we put it in percentage terms you can see it pretty starkly:

image

The problem – and it was always a likely one (and thus, yes the Govt does deserve criticism for it) is that the expected growth of revenue in 2012-13 was rather ambitious.

If we look at the spend in % of GDP terms – which is the ONLY intelligent way to judge the level of revenue and expenditure compared to previous years it again comes out just how different the revenue picture is now compared to 2004-05 – which Tony Abbott in his speech referred to as a good comparison:

image

It’s worth remembering that when Peter Costello allowed (and quite correctly so) the budget to go into deficit in 2001-02 both revenue and expenditure were higher than what Swan is trying to do in 2012-13.

I think it is a pretty strong indictment of Swan that I would wager 95% of voters think it is the other way round.

My piece also looked at cost of living. In the past year the cost of living index has grown by less than the CPI – this is mostly because the CPI doesn’t count mortgage payments – so interest rates can actually rise causing inflation to fall, but cost of living can rise. At the moment it;s the other way round – interest rates have fallen, and thus inflation is a bit higher:

image

Age pensioners who as a rule don’t pay a mortgage don’t get that benefit of lower interest rate.

To cut through the mess of the above graph here’s the pensioners compared to CPI.

As you can see currently they are pretty close to the CPI – especially compared to 2005-06 and 2009-11, so it’s a bit tough to make a case that the CPI is currently giving a distorted picture. But what this graph does demonstrate, is that that is not a situation you can assume always occurs.

image

Friday, February 1, 2013

Andrew Bolt trends towards dodgy graphs

I don’t normally blog about Andrew Bolt, because really, what’s the point? The bloke struggles with basic levels of research (a fact I have encountered personally) and hell, his stuff is pretty much pure opinion (or the opinions given to him by his readers), so there’s not much point saying I disagree with him because, well everyone is entitled to their opinions.
But today he decided to try his hand with some graphs.
The settings for this foray in to the graphic world of data was a comment by Craig Emerson on Twitter with Dr Karl Kruszelnicki:


In response Andrew Bolt today wrote a blog post titled:

In the faint hope Emerson can be educated

And he opens with this line:
One man presents science on the ABC. The other is a senior minister in the government that’s imposed the carbon tax.
You would expect both not to be so ignorant about the very basic data on global warming:
Now it’s a brave man who starts calling others ignorant especially one who is not exactly known for his superb research skills.
In order to prove to Emerson and Dr Karl that they were ignorant Bolt tried his hands at graphing some data.
Now look. I don’t want to get all “demarcation dispute” with Andrew on graphs. Sure they’ve become a bit of my thing. And sure I probably have a passion for graphs that rather goes beyond the healthy stage. But here’s the thing. When I use a graph I know that I have to be just as careful in how I present that graph as I do when I write words, because you can lie just as easily with a graph as you can with words, and I don’t want anyone accusing me of attempting to defraud the public by presenting data that is actually false or misleading.
Bolt presents 5 graphs and I will show them all screenshot just to prove I’m not making this up (because by the time you get to the end of this you’ll be sure I am).
First he presents a “graph” from the Met Office in the UK:


It’s not really a graph worth considering because where the temperature was in January 1997 and December 2012 doesn’t actually say much about the trend, but it does nicely convey to his readers that there has been no increase in temperatures. This graph he’s clearly lifted from somewhere – probably the Watts Up With That website, as that’s usually where he gets his climate change “scoops”.
But then Bolt really goes wrong, because instead of grabbing a graph from somewhere else, he astonishingly decides to do some work himself and produce his own graphs.
He went to the great website Wood for Trees which has pretty much all the data on global temperature recordings you could want. It is a neutral site. No one disputes the data it provides. And best of all it allows you to use that data to make graphs. You can do graphs according to any time period and using a raft of different measures.
Here for example is a graph I made using the GISTEMP data (the NASA guys) from 1972-2012:

I have screen capped it all to show you how these graphs are made. Series 1 – (the red line) is “GISTEMP LOTI global mean from 1972”. LOTI stands for “Land-Ocean-Temperature Index. Series 2 (the Green line) is the Linear Trend from 1972 of “GISTEMP LOTI global mean”.
As you can see it’s a nice upward trend.
Have a look also at the top left of the graph. It clearly labels the red and green lines.
OK. Now here’s the graphs Bolt used and his captions for them (and remember he prefaced these graphs by saying “In the foolish hope that these two men may reconsider their opinions after consulting the evidence”:
First up is UAH. This is the data from the USA’s National Oceanic and Atmospheric Administration (NOAA) and it measures “Tropospheric and lower stratospheric temperature data collected by NOAA's TIROS-N polar-orbiting satellites and adjusted for time-dependent biases by the Global Hydrology and Climate Center at the University of Alabama in Huntsville (UAH)”. OK that’s a mouthful but I want to be exact about what it is.
Bolt version of UAH
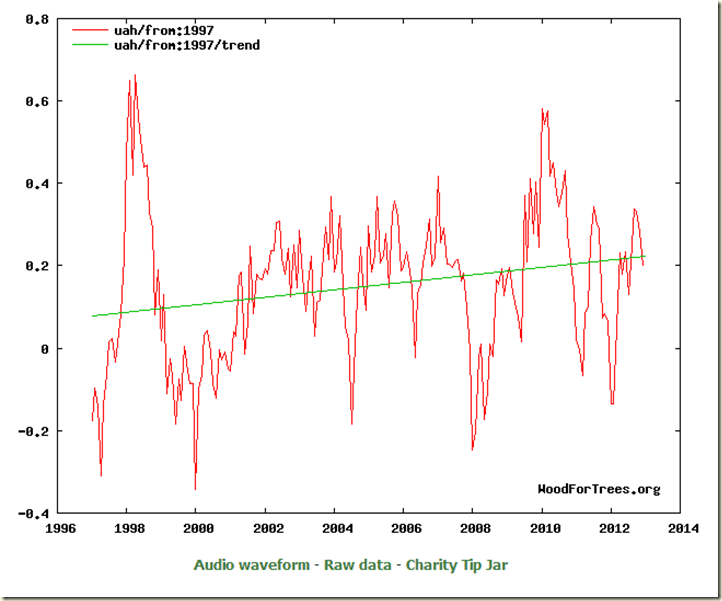
OK. Let’s have a look at this graph. Go up to the top left. What do you see? You see the red line is “uah/ from 1997”, which is what it should be, but the green line – the linear trend line – is from “rss/ from: 1997/ trend”.
That is, the trend line is not the trend of the red line. It is not the trend line of UAH data, it is the trend line of “rss data from 1997”.
What is rss? Well that is also done by NOAA but it is their “remote sensing system’s microwave sounding units”. It rather nicely has shown a flat trend since 1997.
But that is not what Bolt is saying this graph is suggesting.
What he is saying is that the green line shows the trend of UAH measurements has been flat since 1997 – it “confirms” it to use his exact word. .But what he actually has shown is two different measurements. And the measurement he has used as the trend line is from data that reveals a flat trend line. But what about the actual UAH temperatures? Have they been flat?
Let’s use the same data Bolt has used but instead of the “rss linear trend” let’s actually use the UAH data to make a trend – because that is what he is saying his graph displays:
Wood for Trees- UAH Interactive Graphs
Notice anything different? Like the fact the linear trend is now clearly heading up? 
How astonishment.
OK onto his next graph and here we at least see some honesty, because (what a surprise) it is the RSS graph! The trend certainly is flat – if anything it might even be going downwards.
I have no problems saying that, because I trust the data and I am not afraid of admitting what it shows – even if it contradicts the argument I might wish to make about climate change.
RSS
But after the one honest graph of the RSS he quickly moves on to the next bit of “evidence”. We now come to our old friend GISTEMP:
Bolt version of GISTEMP
Notice anything about that top left corner? Yep the wonderful “rss from 1997” trend line.
Gee how did that get there?
Now anyone with mathematical knowledge slightly above that exhibited by the ape creatures of the Indus (thank you Black Adder) would look at that graph and think hang on, that green line isn’t anywhere near the middle of the red lines – which is usually the case for trends (scratch that, not usually – always). But not our Andy. He saw it, and slapped it on his page with a Huzzah you ignorant Craig Emerson, can’t you see even NASA knows temperatures have stopped warming!
Well OK, let’s put in the GISTEMP data to get a linear trend and see what pops up:
Real version of GISTEMP
Hmmm. Now I may be seeing things all crooked after spending two weeks watching Channel 7’s coverage of the tennis, but that green trend line looks to be going up.
OK now he goes back to the UK Met Office and their “HADCRUT” data:
Bolt version of HADCRUT3
Don’t you love the nonchalant “ditto” like he has this whole climate change thing sewn up. And don’t you also like how when you look at the top left corner once again he is using the RSS data to represent the trend for different data. Once again even a basic knowledge of maths would have you realising that that green line could in no way be the trend of the red line.
But not Andrew Bolt. He saw that, saw nothing wrong with it. He put it on his blog and thinks QED.
Note as well that Bolt has used “HADCRUT3”, which has now been superseded by HADCRUT4.
OK what is the real HADCRUT3 trend
Real version of HADCRUT3
Again we see a trend line that is going up. Now sure it is only just going up and I wrote about this on The Drum a couple weeks back. Although it was only just going up I still noted it, even though I was trying to show that climate change is causing temperatures to rise. I did that because I am honest with data and am not trying to pretend the facts are one thing when they are something quite different.
Now Bolt used HADCRUT3. Why didn’t he use the more recent version, HADCRUT4? Maybe because then the trend would look like this:
Real version of HADCRUT4
You can’t even pretend that trend is flat. Also it clearly shows that even by the UK data, 1998 was not the hottest year.
I guess Bolt just wasn’t aware of that data.
Bolt then quotes NASA head climate honcho James Hansen:
An admission from the godfather of global warming, NASA’s James Hansen:
The five-year mean global temperature has been flat for the last decade, which we interpret as a combination of natural variability and a slow down in the growth rate of net climate forcing.
Well OK, but Emerson and Dr Karl was talking since 1998 which is rather a tad more than 5 years (I’m not 100% sure on this, but I sure as hell hope Bolt realises that 2012 minus 1998 is not 5). So Hanson’s quote would be worth citing if Dr Karl had said “the world has warmed in the past 5 years”.
Incidentally here’s the GISTEMP for the past 5 years
GISTEMP 5 years
Yep it is flat.
But here’s the thing. Who gives a damn? No one tries to measure changes in the climate in just 5 year blocks because it is completely meaningless. Here’s what running (reader kalusfloozy rightly points out these means aren’t running [and I didn’t intend them to be either, so sloppy adjective use there]) 5 year trends look like on the graph I had earlier of GISTEMP from 1972
GISTEMP 5 year trends
As you can see some went down, some went flat, some went up. But the trend since 1972 is obvious.
Now look, Bolt normally does such cherry picking. It’s intellectually dishonest, but maybe he actually does believe 5 year trends are important.
But when it comes to representing trends on a graph and suggesting that they show something which they do not, well that is not just intellectually dishonest; it is completely so.
But here’s the kicker he ends his graphs with a quote from Phil Jones regarding temperatures from 1995 to 2009. I’m not sure why Bolt is not concerned about the past 3 years, but oh well, let’s stick with what he thinks is irrefutable evidence.
The line Bolt quotes is this:
I also calculated the trend for the period 1995 to 2009. This trend (0.12C per decade) is positive, but not significant at the 95% significance level.
Rather hilariously he got this line from the great blog Skeptical Science (he even links to it!), which has the quote in full:
BBC: Do you agree that from 1995 to the present there has been no statistically-significant global warming
Phil Jones: Yes, but only just. I also calculated the trend for the period 1995 to 2009. This trend (0.12C per decade) is positive, but not significant at the 95% significance level. The positive trend is quite close to the significance level. Achieving statistical significance in scientific terms is much more likely for longer periods, and much less likely for shorter periods.
BBC: How confident are you that warming has taken place and that humans are mainly responsible?
Phil Jones: I'm 100% confident that the climate has warmed. As to the second question, I would go along with IPCC Chapter 9 - there's evidence that most of the warming since the 1950s is due to human activity.
Bolt for some reason didn’t graph 1995-2009, so I’ll do it for him, using HADCRU4 as that is Phil Jones’ data:
HADCRUT4 1995-2009
Bolt ends his diatribe of misleading information and context-slaughtered quotes by writing:
Do Dr Karl and Emerson truly dispute this evidence? Are they so in denial?
PS: an apology would be nice.
It takes a hell of a lot of front to demand an apology after misleading the public and displaying an utter ignorance of statistics.
Andrew Bolt doesn’t deserves an apology, he deserves censure.
UPDATE
Bolt has now changed his post stating:
(APOLOGIES - I originally and inadvertently used two graphics with the wrong trend line. This HADCRUT graphic is now corrected. The other graphic was of GISTEMP, one of the data sets showing a mild warming.)
That’s not quite accurate either. As you can see from above he “inadvertently” used three graphs with the wrong trend line, not two.  
He puts up the correct HADCRUT graph – still using HADCRUT3 not HADCRUT4. Rather oddly however he doesn’t put the the GISTEMP graph on this new updated blog, he just links to it. And he completely ignores the UAH graph!
Pathetic, really.
****
I note that on some browsers the graphs aren’t coming up. I use Chrome and it seems fine on them, but not on explorer (although you can right click and “show graphs”) and on Firefox it’s just the link. I don’t know why – as I put them up the way I do all my other graphs in the past. Will try and sort it out.

Wednesday, January 30, 2013

ELECTION NOW!!! or in September if that’s your thing…

And so today at the end of a very good speech, the contents of which have now been forgotten by everyone, Julia Gillard announced that the election will be held on September 14. Oh and she has new glasses.

This has pretty much turned everything on its head as prior to her announcement everyone was expecting the election to be held in errr…. September… or possibly October.

So yeah. Game changer.

On a practical level it’s great for the Public Service. Everyone will be able to schedule their holidays now. On the down side, that ready at hand stalling excuse of the APS in election years of “Well we probably shouldn’t start this project because they might call an election” is now sadly redundant. 

There’s been a lot (oh. my. god. a lot) of talk in the past 8 hours about how this will be the longest election campaign.

Please. The Liberals have been campaigning since about 22 August 2010 – Tony Abbott had already announced a “mini-campaign” for this week – which might possibly be the single most superfluous announcement he’s ever made.

The government as well has spent far too much time in campaign mode, and only one the carbon price was locked in last year did they start acting like a government.

Rather oddly the announcement of an election date has caused the media to go into apoplexy with talk of uncharted waters and (oh. my. god) it’ll be an 8 month campaign!! How will we cope!!!. It’s almost like they don’t realise pretty much all the states except Queensland have fixed terms. How do those people in those states survive living in such a bizarro world?election

The reality is that we will have a long campaign, but not because the date was announced now. The election is to be on September 14. The last sitting day of parliament prior to that date is June 27.  Usually after the end of the winter sitting period, having passed the budget and indulged in the press galleries mid-winter ball, MPs fly off overseas for “USA-Australia” conferences and the like. Mostly politics goes off the boil for a few weeks. Not this year.

Who wants to go on an overseas jaunt when your opponent will be doorknocking in your constituency?

So that is ELEVEN weeks from the last sitting day till the election.

Now sure, the writs won’t be issued until August 12, so the Government will still keep governing, but in reality the campaign will have begun. The trick for both sides is how to pace themselves. No one wants 11 weeks of TV adverts, and I doubt either side could afford them – the ALP sure as hell couldn’t.

Similarly, the campaign bus won’t actually start till the official campaign does, so from 27 June till 12 August we’re going to a have a six week phoney campaign where every one will know the election is coming, everyone will know there’s no new legislation to be passed or even debated. That’s a hell of a lot of space to fill with some kind of substance, but not so much substance that you have nothing left to say in the actual campaign.

I suspect both sides will be looking at how the Americans do it because they have around 8-9 weeks from the party conventions until the Presidential election, and that’s the kind of real time frame we’re talking here – not 8 months.

This gap is why I had been thinking 11 October, because then parliament could have sat until August 29, and the PM could announce the election prior to the September sitting weeks.

But that’s all moot now, and as a fan of fixed elections, I think this is an excellent decision.

The other “big” thing has been that 14 September is Yom Kippur.

Well geez. Good thing we’re a secular nation with a separation of church and state. And for that matter, good thing we’re a nation that allows pre-polling.

My favourite aspect of this is the big outrage from everyone except the leaders of the Jewish community. As news.com.au even reported:

But director of the Executive Council of Australian Jewry, Peter Wertheim, says the majority of Australia's 107,000 Jews would not be fussed about the date.

"To be absolutely truthful it is not a major issue for us, because every election takes place on the Jewish Sabbath," Mr Wertheim told news.com.au.

“Not a major issue” but you know, let’s pretend it is one.  It’s January 30 and already the bullsh*t scale of media political coverage has zoomed past that of 2012. Pace yourselves people, pace yourselves. At this rate there’ll be nothing left to beat-up come September. Oh who am I kidding. Of course there will be.

Look, we don’t have elections over Easter or on Christmas Day not because that would be a great slur on Christians but because it would be a complete chaos. People over Easter and Christmas on masse go away for holidays, and as a rule you want to hold elections on weekends in which people are not likely to be away from home. It’s the same reason they’re never held on the Queens Birthday or Labour Day etc.

We can’t hold an election because of a religion practised by about 0.5% of the population? And we’re not allowed to do that even though it will not actually stop those people from voting?

Surely there are enough real things to get worked up about than these faux outrages where no one is actually all that outraged.

So is this a political masterstroke? Well I don’t know. And neither does anyone else. It won’t stop many though from pontificating about it. The old adage is the government has a big advantage knowing when the election will be called. But this year because an early election would’ve meant a house only one, and because the ALP is behind in the polls, it was always going to be September-October (possibly November but that’d be a stretch).

So I don’t think loses much of a tactical advantage on that score.

The PM in her speech said:

But the benefit of fixing the date now is not just the end of speculation about election timing.

It gives shape and order to the year and enables it to be one not of fevered campaigning, but of cool and reasoned deliberation.

That sounds nice. But based on the past 8 hours, the signs ain’t good.

Thursday, January 24, 2013

Australian Open: Recap at this point

OK, well we’re at the semi final stage in both the men’s and women’s.

The women will be playing soon, but before I get to that, let’s go back to my preview post wherein I covered the women’s side of the tournament like this:

In the women’s?

Serena Williams. She might even lose a set along the way.

At the time Sally Jackson tweeted to me:

Nice analysis but women's tennis is more interesting than just Serena.

And she was right.

I’ve never been a big fan of Williams. Mostly because of things like this:

And this. And because of things like this in her press conference after losing to Sloane Stephens:

Q.  What did you think of the quality of the match before you tweaked the back?

SERENA WILLIAMS:  I don't think my level was high.  I don't know how many unforced errors I ended up hitting, but for sure more in one set than I probably did in the whole tournament.

So I think her level was high.  But as for my end, I mean, you can tell.  You each can say this is definitely not my best match in months.

Yeah Williams was up 6-3 2-0, but you see, she really wasn’t playing very well. Her opponent? Well she was playing “very high” – you have to don’t you know to beat Serena (and of course you also need Serena to play really bad). Every defeat is always like that for Williams. There’s usually an injury or she really didn’t play well at all, unlike her opponent who obviously played the match of her life.

That said, I think the injury – both ankle and back were the key – let’s be honest, Serena Williams doesn’t serve 135km/h if healthy. Sloane played very well, but I don’t see her winning unless Serena twigs the back.

But even saying that – how great is it to see Stephens win? Talk about a breathe of fresh air in the game. Genuine delight, and certainly no flash in the pan. This win probably came earlier than expected, but that’s sport – it’s a test of body as well as skill, and there is many a player who “could’ve won” were it not for an injury. Winners get their body through the match somehow.

OK. Who wins from here? Hard to go past the two top seeds, but as I write this La Ni (or Ni La) just beat Sharapova. That means at least for a quieter match than would have been Sharapova v Azarenka. I’ll go for Azarenka to win her semi in straight sets, and the final in 3.

***

Here’s what the past 10 days have taught us about men’s tennis:

  1. Novak Djokovic is now a legitimate candidate for the Top 10 of the ATP era.

If we go from 1973 when the ATP began – which is a few years after the “Open era” started in 1968 – it’s pretty easy to reel off the top 8 (the order more tricky):

Borg, Connors, McEnroe, Lendl, Sampras, Agassi, Federer, Nadal.

Without any doubt these are the best 8. They own it not just in Grand Slam titles but in time spent as number 1.

But who comes 9th and 10th? Strong cases can be made for Edberg (6 Grand Slams), Wilander (7 Grand Slams), Becker (6 Grand Slams), and maybe Courier (4 Grand Slams). I’d leave Leyton Hewitt out of that top 10 even though he was number one for the 9th longest period, because with only 2 grand slam titles he really didn’t cash in when he was at the top, and I doubt he was ever the prohibitive favourite in any Grand Slam he entered.

Djokovic with (thus far) 5 grand slam titles has to now be part of that conversation. And what really has elevated him into the top 10 for mine is his consistency. By reaching the semi final he has now made 11 consecutive grand slam semi finals. Only one other person has done that – Federer. Third best is Lendl with 10 in a row. So Djokovic is in big company. Incidentally Federer’s record is 23, so Djokovic only needs to keep making the semi finals until the Australian Open of 2016 to tie it.

By making the Quarter Finals here, Djokovic also extended his consecutive run of QFs at grand slams. Lendl had made 13 in a row, Djokovic is now on 15. Federer by beating Raonic took his streak to 35. Which is so long that it’s almost a bit silly. Djokovic will only need to keep making the QF until the Australian Open in 2018 to tie that. He will only be 30 by then, so it is certainly doable, but it requires no injuries and lapses at all.

Djokovic’s defensive play is beyond that anyone else has ever played. He just gets everything back, and gets it back in a manner that quickly turns defence into offence. It is the one area that I think he is better at than Federer ever was. 

At this point I put Djokovic 9th all time ATP era, and he’s only a couple titles away from being part of a top 9 in which his place in the order is up for strong debate.

2.  Generation Next ain’t there yet.

Ryan Harrison was pretty well embarrassed by Djokovic in the 2nd round, and Federer took care of first Tomic and then Raonic. Along the way Gigor Dimitrov lost in the first round as did Goffin. Jerzy Janoicz made it to the 3rd round, which will put him into the top 25 as he didn’t play in the Open last year. Andrey Kuznetsov did very well to beat 11th seed Juan Monaco in the first round, but he was then “bundled out” in the second by Kevin Anderson.

No one really stood up and said, I’ve arrived.

3. Generation Next is coming.

The 3rd round match against Federer was an excellent reality check for Tomic, and also for his critics.

It showed the BIG difference between playing an exhibition match against a jet-lagged Djokovic and playing a Grand Slam match against number 2 in the world. If there is one thing this summer of tennis should remind everyone it is that exhibition matches like the Hopman Cup and Kooyong Classic do not count for anything!

Here’s why – go to the ATP tour website and look at the Tomic-Djokovic match up. It is 3-0 to Djokovic. The Hopman Cup does not count. It is slightly as relevant as a pre-season AFL practice match.

For Tomic it was a big match – good for profile if he wins it, good for sponsorship, good all round. Djokovic was just hoping to have a good hit out and not get injured.

If the match is worth no ranking points, then that is how much it is worth in terms of reality. Sure players like to win, but it is a paid practice match. For Tomic the Hopman Cup showed he was in good form, but the Sydney International was the one that really mattered, and it was also the one that provided the true guide to his form.

At Sydney the highest ranked opponent Tomic beat was Andreas Seppi at number 23. In the Oz Open he beat the number 72 and number 120 in the world. So he didn’t really claim any scalps. BUT he did show he was good enough to be in the top 20.

His game against Federer was very good. He was able to stick with Federer for a number of shots, and probably deserved to win the 2nd set. But in tennis probably deserving doesn’t cut it.

Tomic’s serve is quality, and his forehand is very good. His movement needs to improve, but he is much better than this time last year.

Top 20 must be the goal this year and his game is certainly good enough – he troubled Federer for 2 sets, and while he went away in the 3rd, that is more about age and the difference between tournament best of 3 and grand slam best of 5.

So if you don’t like him, get used to not liking him for a while, because he will rise up the rankings. But it’s tough. How tough? Well after his great summer, where he won his first title, he leaves the Australian Open with only 70 extra rankings points than he had this time last year. To put that in context, he currently lies 765 points behind the number 20 in the world. He needs to play as good has he did this month, every month. And that is hard when you’re a long way from home, and you’re playing on the outside courts.

It is a tough, tough grind to get to the top.

Raonic as well is going to get “there”. He is now number 15 in the world. He reached the 4th round like he did last year, but he now has a couple tournaments where he has to defend points – San Jose which he won last year, and Memphis, where he came runner up. But for Raonic the big prizes are Masters events. At Indian Wells and Miami last year he lost in the 3rd round – to Federer and Murray respectively. With a higher ranking he might get a better draw that will see him face the big guys in the QFs – and every improvement gets him that much closer to the top 10.

His serve is such that in a best of 3 he really can do some damage. If he’s on, he’ll be impossible to break and even if he can’t break his opponent, you’d back him in a tie breaker. Oddly he has only made the 2nd round at Wimbledon the two times he has played it. I can’t see that remaining the case for much longer.

4. Nadal is a big loss, but the top 4 is closer to the rest than it has been

The top 4 seeds made it to the semis, but no one – perhaps not even David Ferrer considers Ferrer a tougher match up for Djokovic than would have been Nadal. But that aside, the QFs played by Djokoivc and Federer were top matches. Wawrinka stepped up and really should have won. A bit of luck, a few line calls… but there’s a reason why Djokovic is number 1, and it ain’t because he has won matches because of a bit of luck and a few line calls.

Similarly Tsonga played all over Federer at times. Federer stole the third set tie breaker when Tsonga’s game seemed bigger and better. Federer’s class rose to the top in the 5th, but Tsonga is coming, and looks like he has decided this is the year. He’ll become number 6 in the world after this – although until Nadal comes back that is effectively number 5. That means he has very good draws in the Masters events, and he has the game to win 2 sets off anyone – and in best of 3 that’s all you need.

The biggest disappointment of the tournament for me was Juan Del Potro losing in the 3rd round. He was my sneaky outsider tip. His loss meant Andy Murray played Chardy in the QF and, to be honest, by that stage Chardy had done his dash. At 25 Chardy will certainly rise up the rankings, but he was never going to challenge Murray in the way that Del Potro could have. But to win a QF you got to first get there, and Del Potro didn’t.

OK the semis:

In last year’s semi final Djokovic beat Ferrer  2-6 6-1 6-4 6-2. And if I had to predict the games scores as well as the result, I’d go with that line again. 4 sets. Sportsbet has Ferrer at $7.10 which is just stupid, and almost worth a punt. $7.10 in a two horse race? Absurd, especially when Ferrer is 5th best in the world.

The Federer-Murray one is juicy. Murray has hardly been stretched. He played Simon in the 4th round when Simon was physically exhausted just by getting out of his chair to go do the coin toss, and Chardy was not a great guide.

In the past the key aspect would have been does Murray have the mental game to win at this level. After the Olympics and US Open that question no longer arises (though I think it still will when it comes to Wimbledon). Since the Olympics, they have met twice – Murray won in Shanghai, and Federer won in London. These two are very even but Murray is slight favourite with the bookies and I think he should be. This has 5 sets written all over it. I think Murray will win, even though (as ever) I’ll be hoping for Federer.

I just think had Murray been playing last night against Federer he would have won, so Federer will need to play better than he did in that match (getting in more than 61% of his first serves would be a good start).

Thursday, January 17, 2013

Australia’s Unemployment Rate–5.4% (Hello Newman)

Today the ABS released the December 2012 numbers, which now means the past 5 years encompasses only the Rudd/Gillard years.

The figures showed the seasonally adjusted unemployment rate shifting from 5.3% to 5.4%. The November figure was revised up from 5.2% to 5.3%, which sounds a big shift, but really it was just revised from 5.23% to 5.25%.

The trend figure was steady at 5.4% (the November 2012 figure was also revised up due to a bit of rounding)

image

A look at the past 12 months shows the obvious trend – up

image

So why did the unemployment rate go up?

Well in seasonally adjusted terms employment decreased 5,500 (0.0%) to 11,538,900. In trend terms employment went up by 7,000 jobs

image

But before we get to the breakdown into full-time and part time, male and female etc, let’s look at the states, because that provides a pretty good answer as to why the unemployment rate went up.

While the national seasonally adjusted job numbers fell 5,500, in Queensland alone there was a loss of 22,900 jobs.

Ouch.

It leads us to this glorious picture:

image

Yeah. Not pretty.

But look. Let’s be fair. The state employment data at a seasonally adjusted level is really quite erratic, and it if far best to look at the trend rate. And here Queensland actually did have employment growth – a whopping 0.0039%. And here’s how it and the rest of the states line-up:

image

Well done Campbell Newman and Tim Nicholls. All that austerity is working a treat.

Polytics on Twitter has noted the seriously dopey media release put out by Nicholls, and it deserves quoting:

Treasurer Tim Nicholls said the figures, while disappointing, were reflected in the Mid Year Fiscal and Economic Review which was released in December 2012.

“A weaker global outlook, including certainty about the US ‘fiscal cliff’ and a decline in commodity prices, has seen business remain cautious which has led to a weakening in labour market conditions in Queensland,” Mr Nicholls said.

“This is reflected right across Australia, with 5,500 jobs lost nationwide in December.

So an LNP treasurer is quoting MYEFO to defend his own job numbers! Well yes, I can see why he would… but given everywhere else seemed to be able to cope, it doesn’t really hold much water. And you have to give points to his media team – it’s always good to mention the national jobs loss figure when your own state figure is over 4 times that number! But he did find some sunshine:

Mr Nicholls said the seasonally adjusted estimates seemed volatile and it was important to look at trend figures.

“The trend is much more stable and shows 100 new jobs in December,” he said.

Yep. 100 new jobs. Wow. It’s the boom state!!

OK lets look how Australia would be doing if we ditched QLD (and each of the other state for reference):

image

Were it not for the successful work of Newman and Nicholls Australia would have an unemployment rate of 5.1%.

This leads to QLD being a drag on the national rate well beyond that of any other state:

image

And it leads to this difference between the QLD unemployment rate and the national figure:

image

Try and spin that one into a success for austerity.

***

Having spent a bit of time looking at climate change data anomalies from averages, I thought about looking at the unemployment rate in the same way. So I’ve graphed the unemployment rate compared to the 1978-1998 average (so less than zero means the rate is below that average – which is 8.1%)

image

What it does show is how nice we are doing.

But if you look at the anomaly of annual employment growth from that 1978-1998 average (1.8%) we see a different picture:

image

Our current employment growth is pretty weak – below average in fact, and certainly no sign of any warming….

***

OK back to this month’s figures. The employment numbers break down in seasonally adjusted terms as:

Full-time employment decreased 13,800 to 8,112,500 and part-time employment increased 8,300 to 3,426,400.

image

The trend growth is staying positive, mostly on the back of the big jump in the May and September 2012 figures. This decline in full time jobs has not surprisingly led to an increase in the unemployment rate of people looking for full-time work:

image

A look at the difference between the two in trend terms shows a slight narrowing:

image

Any narrowing of this measure is good because a look over the past 30 years shows when the 2 rates are close, the economy is doing well (and when the looking for FT unemployment rate is below the national rate we’re likely in overcooking territory:

image

Now my favourite measure of how the labour market is fairing is trend growth in hours worked. It shows a slight increase, but until it gets over 0.2%. we can still describe it as weak.

image

Interestingly – especially given the drop in full time work, in trend terms men’s employment growth has now overtaken women’s:

image

The employment to population ratio continue its long decline from the peak of April 2008.

image

It is now at the point it was during the GFC, and yet we are clearly not in a panic stage of a GFC style recession. That in itself displays how the labour market has changed.

Wednesday, January 16, 2013

Drum Piece: Productivity, Climate Change and Facts

My Drum piece today covers the rather comment-bait friendly topic of climate change.

I thought about writing it when I saw this graph on US temperatures that fairly well shocked me:

YTD_allyears_Dec2012

Now of course the United States is not the whole world, but for 2012 to be the hottest on record by around 1 degree F or about 0.55C is pretty jaw-dropping.

Then I looked at the world figures going back to 1880. It is all a bit confusing and tough to label all the year, so I have made 2012 the black line and all the red lines are the years from 2000 onwards:

image

Or linearly in annual mean terms it is:

image

Now I’m a big fan of looking at things long term to find some context, so I though since I’m 40, I wonder how many of the hottest 40 years have occurred since I have been alive:

image

Clearly my arrival on the planet has caused some imbalance in the climate. There can be no other explanation.

In my article today I also had a bit of a slap at The Oz’s coverage of the environment. I really should be sanctioned for doing so – it isn’t seemly to shoot fish in a barrel so publicly. In my defence, as I had already submitted my article yesterday morning I was denied the use of Graham Lloyd’s classic headline “Sea rise ‘not linked to warming’ says report”. This meant I could not make use of the great image created by Mark Whalan on Twitter comparing the original article with an AAP report that came out loter int eh day after the co-author of the study Lloyd cited refuted his article completely:

BArSfAeCAAASCT6

The good thing about most coverage of amazing new discoveries on the non-existence of climate change reported either in The Oz or various denialist blogs that get a run on news.ltd sites is how they invariably arrive about 5-7 days after they have been circulating on environment blogs.

Take the report on sea level rises in yesterday Oz. It was covered on the Real Climate blog a week ago (and with rather a bit more intelligence – though let’s be honest, that ain’t a high bar to get over).

The standard process for me when reading one of these types of stories is to think “Well that sounds interesting… but there’s probably more to it..”, then go online look at various blogs, find the “new research” is a week to a month old and finds almost the opposite of what was reported, or (quite often) was not even examining the areas on which the newspaper report says it has found startling evidence.

Ahh well, at least this time The Oz didn’t publish a response citing the “Australian Pocket Oxford Dictionary” on the meaning of the words used in its headline.

****

A commenter linked to this excellent video from NASA on the shift of temperature anomalies:

***

And this morning the thing doing the rounds is that GISS head James Hansen has put out a paper (pdf) that starts with:

Global temperature thus continues at a high level that is sufficient to cause a substantial increase in the frequency of extreme warm anomalies. The 5-year mean global temperature has been flat for a decade, which we interpret as a combination of natural variability and a slowdown in the growth rate of the net climate forcing.

This is apparently a big statement. An admission, if you will! Oh my gosh he has admitted what his data found!! The scandal!!!

Of course it’s probably if you want to think that to not read the whole paper because then you’d see things like this:

Indeed, the current stand-still of the 5-year running mean global temperature may be largely a consequence of the fact that the first half of the past 10 years had predominately El Nino conditions, while the second half had predominately La Nina conditions (Nino index in Fig. 1). Comparing the global temperature at the time of the most recent three La Ninas (1999-2000, 2008, and 2011-2012), it is apparent that global temperature has continued to rise between recent years of comparable tropical temperature, indeed, at a rate of warming similar to that of the previous three decades. We conclude that background global warming is continuing, consistent with the known planetary energy imbalance, even though it is likely that the slowdown in climate forcing growth rate contributed to the recent apparent standstill in global temperature.

And if that sounds too sciency, there’s an excellent video representation of this from Skeptical Science:

Friday, January 11, 2013

Australian Open Preview

Next week the first tennis Grand Slam of the year begins, a year I have a feeling might see a bit of a changing of the guard.

In my Drum piece this week I had a bit of a squiz at Bernard Tomic and his hopes to be in the top 10 by the end of the year. I should state at the outset that I am not a fan of Tomic. Maybe I just am an old miserable cuss who can’t stand 20 year old braggarts driving around in muscle cars and telling everyone that they’re going to be the greatest player in the game. I’ve never been big on the “you have to support them because they’re Australian”  line either. In Davis Cup? Sure. But tennis is an individual sport, so I’ll pick the individuals who I wish to cheer for.

That said I will be shocked if he’s not in the top 20 by the end of the year. Top 10 is a bigger ask mostly because it requires someone dropping out for him to get in.

Here’s the current top 25 (Tomic is 64, but it’s really around 50 because he skipped the Brisbane International and played in Sydney, so he lost the points he won there last year, but he’ll essentially get them back with a few more from his play in Sydney):

Rank, Name & Nationality Points Week Change Tourn Played
1 Djokovic, Novak (SRB) 12,920 0 18
2 Federer, Roger (SUI) 10,265 0 20
3 Murray, Andy (GBR) 8,000 0 20
4 Nadal, Rafael (ESP) 6,600 0 17
5 Ferrer, David (ESP) 6,505 0 26
6 Berdych, Tomas (CZE) 4,680 0 25
7 Del Potro, Juan Martin (ARG) 4,480 0 23
8 Tsonga, Jo-Wilfried (FRA) 3,375 0 25
9 Tipsarevic, Janko (SRB) 3,090 0 28
10 Gasquet, Richard (FRA) 2,720 0 24
11 Almagro, Nicolas (ESP) 2,515 0 26
12 Monaco, Juan (ARG) 2,430 0 24
13 Isner, John (USA) 2,215 1 26
14 Cilic, Marin (CRO) 2,210 1 24
15 Raonic, Milos (CAN) 2,175 -2 24
16 Simon, Gilles (FRA) 2,145 0 27
17 Wawrinka, Stanislas (SUI) 1,900 0 22
18 Nishikori, Kei (JPN) 1,870 1 23
19 Kohlschreiber, Philipp (GER) 1,770 1 27
20 Dolgopolov, Alexandr (UKR) 1,750 -2 26
21 Haas, Tommy (GER) 1,681 0 20
22 Querrey, Sam (USA) 1,650 0 27
23 Seppi, Andreas (ITA) 1,560 0 30
24 Verdasco, Fernando (ESP) 1,490 0 25
25 Youzhny, Mikhail (RUS) 1,335 0 25

OK the top 4 I can’t see dropping out. Nadal has his injury, but his ranking is protected, and the guy has won Grand Slams on one knee before, so he ain’t dropping down too far yet. Federer I think is the one in danger. Age surely must hit at some point (though I have been thinking this for a few years now). The first 6 months of 2012 were great for him, so he has a ton of points to defend – a semi at the Aust Open, and wins at Indian Wells, Dubai and Rotterdam. The Madrid tournament won’t be on blue clay this year – a surface that seemed to suit his game more than others, so that’ll be tough to defend. That said – it’s a long way for him to fall out of the top 10.

Ferrer, Berdych, Del Potro and Tsonga should be ok – I especially think Del Potro could be the one to rise. Ferrer could fall – and I doubt he’ll be number 5 in 12 months time. Tipsarevic has the win in Chennai in the bank for 12 months, and really doesn’t have much at the Grand Slams to defend – his best is a QF at the US Open. So there’s a fair bit of upside for him. But he is 28, so maybe he’s peaked. Gasquet has the win in Doha in his bank, and he made the 4th round of every Grand Slam, so a QF in any of them will give him 180 extra points – and every extra point put you further away from those trying to catch you. He also has made a solid and steady rise up the rankings from being number 30 this time 2 years ago. At the age of 26 he would be feeling like the next 2 years are his peak.

Then come the others in the top 20. Roanic, Cilic, Nishikori and Dolgopolov are the “young ones” (if 24 is young in the case of Cilic and Dolgopolov) on the rise. Both Cilic and Nishikori made the QF of last year’s Aussie Open, and both also missed the US Open. So while they have big points to defend in the next fortnight, they won’t have any when they get to Flushing Meadows. Nishikori didn’t make it past the 4th round of any Master event last year, so there’s points there to be made.

Those four are guys on the improve, for Tomic to make the Top 10 he not only has to displace one of the current top 10 he also has to get in front of these 4 (and the other 6 in the top 20). Tomic’s current rankings points are loaded mostly with the 4th round at last year’s Aussie Open. In his favour are that he was poor at Wimbledon, so he can improve there.

As I say, top 20 is a big show – but I will go so far as to say anything less than top 20 by the end of the year will be a disappointment. Top 10 would be a very good effort – certainly possible, but the year is long, and he had a great Australian summer last year as well, so it’s in the long months away from Australia where he needs to improve.

OK to to the Australian Open draws.

Djokovic has a quarter that has him set to play number 5 seed Berdych in the QF. To get there Djokovic might have to play young USA up and comer Ryan Harrison. Harrison at 20 years of age is a few steps behind the same aged Tomic at the moment, but the match would be a nice one to watch to see where both are at. Wawrinka or Querry in the 4th Round should be no danger for Djokovic. Berdych meanwhile will have to go through Juan Moncao or Verdasco to get to the QF. He should.

In the same half of the draw is David Ferrer who is due to meet Tipsaravic in the QF. Ferrer will likely have to go the dangerous Ivo Karlovic, Baghdahtis, Mikail Youzny or Nishikori. Depending on Nishikori’s fitness, I’m thinking he could be the upset factor here.

Tipsarevic faces Leyton Hewitt first up. I don’t think an upset is out of the question, but I wouldn’t put money on it. In his 16th of the draw I’m interested to see how Grigor Dimitrov goes. He faces number 32 seed Julien Bennetau in the first round. I’d like to see an upset.

In the bottom half we start with Del Potro who is slated to meet Andy Murray in the QF. I can’t see anyone stopping Del Potro getting to the final 8. Similarly Murray has a cruisey draw. Their QF would be a cracker.

Roger Federer has easily the toughest draw of the top seeds. He is slated to meet Tsonga in the QF, but to get there he needs to beat firstly the young Frenchman Benoit Paire, then probably the veteran Davydenko. The 3rd round is tough – likely a very in-form Bernard Tomic, and then a 4th round if he makes it against Raonic. It really is a case of the old man having to defend himself against the wannabe future. Federer’s run of 34 consecutive Grand Slam QF’s will face a supreme test. To be honest I am not sure he’ll get there. If he does it’ll mean he is playing very good tennis, and I'd back him against Tsonga, who has a pretty clear run to the QF.

The toughest aspect with Federer is he hasn’t played any tournaments of late so there’s a risk he’ll be too rusty in the early rounds. A few years ago he might have got away with it, but this year, with his draw, he’ll need to be sharp from the get go.

And that will bring us to the second week.

In the women’s?

Serena Williams. She might even lose a set along the way.